
There are dozens of metrics being used by software teams to measure quality regularly. But too often, C-level executives focus on high-level dashboards or financial KPIs without giving software testing metrics the attention they deserve — or they get lost in a flood of technical details that don’t impact strategic decisions. Not all metrics carry equal weight at the executive level; the ones that matter reveal risks, business impact, and opportunities for smarter investment in technology.
By prioritizing the right testing metrics, leaders gain insight into software stability, operational efficiency, and customer trust. These metrics help executives make informed decisions on release timing, resource allocation, and long-term strategy, turning raw numbers into actionable intelligence that drives growth and resilience. Find out more about which metrics you should use and why from our testing metrics guide.
Key Takeaways
- Software testing metrics help executives monitor software quality, assess business risks, and make informed strategic decisions.
- Defect and error metrics, test coverage, reliability, and operational metrics are essential for evaluating software performance and stability.
- Customer and business impact metrics, such as satisfaction, adoption, and retention, connect QA efforts directly to business outcomes.
- Cost and investment metrics, including cost of quality and rework rates, guide decisions on resource allocation and QA investments.
- Emerging strategic metrics, such as capability enablement rate and infrastructure efficiency, measure the business value of software improvements.
- Product, project, and process metrics provide insights into software quality, project progress, and workflow effectiveness, helping executives optimize delivery.
- Executives can avoid common pitfalls by contextualizing metrics, differentiating manual and automated results, and tracking trends over time.
- Best practices include prioritizing high-value metrics, using dashboards, aligning with business goals, automating collection, and combining quantitative data with qualitative insights.
Why Do Metrics in Software Testing Matter at an Executive Level?
For C-level specialists, software testing metrics provide critical insight into software quality, project progress, and business impact. While the testing team focuses on defect counts, executed test cases, and daily testing activities, executives need metrics that clearly indicate risks, efficiency, and readiness for release.
There are several reasons why metrics for QA and testing matter at the executive level:
- Risk management. Metrics in software testing identify defects in the software that could affect end users, compliance, or brand reputation. High defect density or a rising defect severity index signals product risks that require attention from leadership.
- Resource allocation. Metrics provide insights into the cost of testing, the balance between manual testing and test automation, and the overall testing effort. This enables executives to make informed decisions about investing in automation platforms, scaling the testing team, or adjusting project timelines.
- Business alignment. Software quality assurance metrics demonstrate whether testing activities support strategic objectives, such as faster time-to-market or improved customer experience. Tracking defect leakage or test case effectiveness helps assess whether the software is ready for release.
- Decision-making confidence. Clear software test metrics calculation and visualization give executives the information they need to approve releases, allocate budgets, or shift priorities across the software development lifecycle.

Important software testing metrics bridge the gap between technical execution and strategic oversight. They allow executives to monitor software quality and testing performance in a way that directly supports business decisions, making software QA metrics invaluable for the entire delivery process.
From Unit Test Coverage to Time to Test: The Full Guide to QA Metrics and KPIs.

What Are the Key Types of Software Testing Metrics to Monitor as an Executive?
To understand which metrics truly matter at the executive level, we surveyed a range of CTOs, CEOs, VPs, and other tech leaders across industries. We asked them which software testing and quality metrics they monitor closely, how these metrics influence the software product strategy, and how they process the insights.
Based on their input, the most valuable metrics can be grouped into the following categories:
1. Defect and error metrics
- Defect density/escaped defects: Measures the number of defects per unit of code or those that reach production. High values indicate risk to customers and product stability. For example, Harisha Patangay from Kanerika highlighted defect escape rate as a key signal for release planning and resource allocation.
- Error rate in production: Tracks incidents and failures observed by end users. Rising errors can indicate gaps in QA or potential churn risk. Yehor Melnykov from Loio emphasized monitoring error rates to detect hidden “quality debt” early.
2. Test coverage and QA effectiveness
- Test coverage of critical workflows: Ensures that the most important business scenarios are consistently tested. Low coverage flags potential operational or strategic risk. Several respondents, including Waqas Anwar from Summo Sports, noted that executives watch coverage to guide investment in automation.
- Automated test execution rate: Tracks how many automated tests run successfully over time, reflecting QA efficiency and process maturity.
3. Reliability and operational metrics
- System reliability (uptime/availability): Measures whether the software remains operational for users. Downtime directly affects trust and revenue. Beverley Chengetai from Veridapt stressed uptime as a leading indicator of market readiness.
- Mean Time to Recovery (MTTR): Tracks how quickly systems recover from failures. Faster recovery signals operational resilience.
- Deployment frequency/change failure rate: Shows how quickly and safely new features or fixes are released. It also balances speed with stability, as noted by Julia Duran from South Geeks.
4. Customer and business impact metrics
- Customer satisfaction (CSAT/NPS): Measures perceived quality and satisfaction. Declines often indicate friction in adoption or functionality. Justin Wheeler from Funraise highlighted these metrics as signals of organizational maturity and user trust.
- User adoption rate: Tracks how many customers actively use new features or releases, linking QA to business value. Bogdan Condurache from Brizy emphasized adoption as a critical measure for product success.
- Customer retention/churn impact: Connects quality to long-term revenue and market confidence, as Dhanvin Sriram from Luppa AI highlighted.
5. Cost and investment metrics
- Cost of quality (CoQ): Captures the total investment in preventing, detecting, and fixing defects, helping executives justify QA spending. Bhaskar Dhawan from Mastek noted that CoQ reframes testing as a measurable business investment.
- Rework rate/defect trend by module: Shows where resources are spent fixing problems versus building new features.
6. Emerging strategic metrics
- Capability enablement rate: Measures how much new functionality or business opportunity software enables. John Overton from Kove IO described this as a way to track technology’s contribution to competitive advantage.
- Infrastructure efficiency multiplier: Quantifies how much more work is done with the same hardware after software improvements, useful for AI/ML-heavy systems.
Product, project, and process metrics
- Product metrics: Focus on the quality of the software itself. Examples include defect density, defect severity index, escaped defects, and feature adoption rates. Product metrics help executives understand whether the software product meets customer expectations, is reliable, and aligns with business goals.
- Project metrics: Track how efficiently a development or testing initiative is progressing. Key metrics include test execution rates, test coverage, completion of testing activities, cycle time, and release predictability. Project metrics allow executives to make strategic decisions about resource allocation, release timing, and overall project health.
- Process metrics: Evaluate the effectiveness of the development and testing workflows. Examples include test case effectiveness, manual testing metrics, automated testing metrics, and testing productivity measures. Process metrics provide insight into the testing process, highlighting areas for improvement and optimization across development and testing teams.

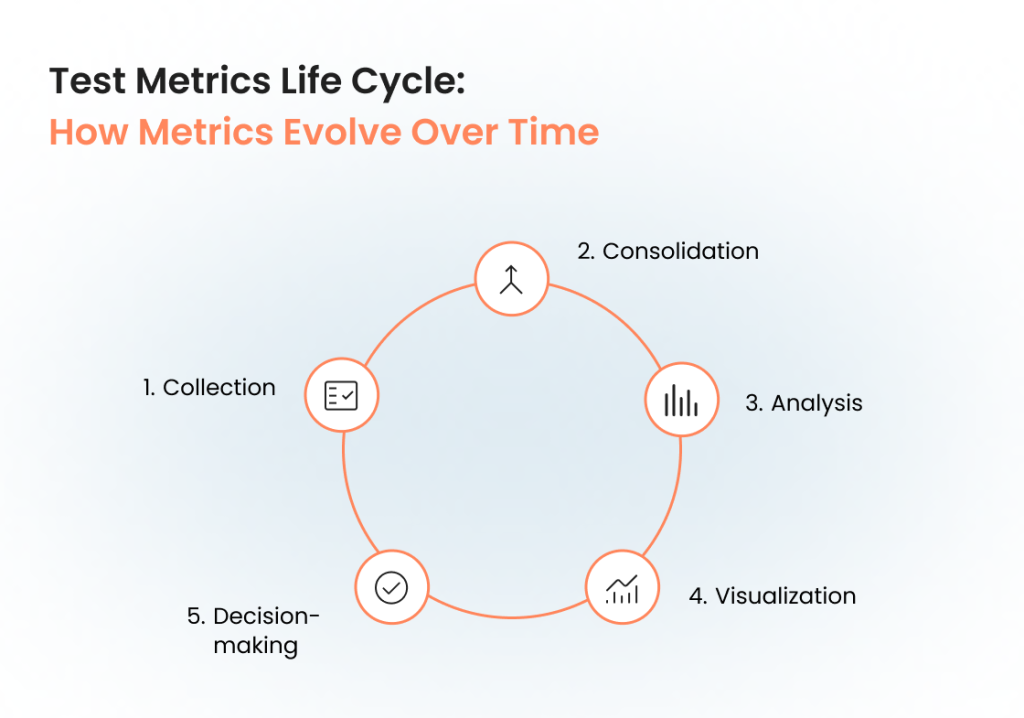
Test Metrics Life Cycle: How Metrics Evolve Over Time
Software testing metrics are quantitative measures that give executives a structured way to track the progress of the testing process and evaluate the overall health of the software testing. While the testing team collects many raw numbers during day-to-day testing activities, the real value for C-level leaders comes when those numbers evolve into insights that support business decisions. This is where the test metrics life cycle plays an essential role.
The life cycle shows how software test metrics move from basic data points to management metrics that influence strategic direction. It typically includes five stages:
- Collection. At the start of the test process, the software testing team gathers raw data such as the number of test cases executed, defects logged, defect severity index, and testing time. These fundamental software testing metrics are the building blocks for later analysis.
- Consolidation. Data from multiple sources (manual testing, automated testing, defect tracking systems, user acceptance testing) is combined. For example, linking executed test cases with customer-reported defects in the software creates a stronger context.
- Analysis. This stage transforms raw data into meaningful information. Metrics provide insights into the efficiency of the testing process, such as defect density or test efficiency. Derivative metrics help identify weaknesses in the software project — for example, high defect leakage may indicate low coverage of testing.
- Visualization. Consolidated and analyzed metrics are presented in a way that executives can quickly grasp. Dashboards or scorecards summarize qa testing metrics into higher-level indicators such as release readiness or cost of testing trends. This is where metrics like test automation metrics or manual testing metrics are aggregated into views aligned with business goals.
- Decision-making. At the final stage, software quality assurance metrics become business enablers within the software development life cycle. Executives use them to determine whether the software is ready for release, whether additional testing effort is needed, or whether investment in a test automation platform is justified. The right metrics give leaders confidence in critical decisions about timelines, budgets, and priorities in delivering high-quality software products.
By following this life cycle, critical software testing metrics provide insights not just into the effectiveness of the QA process but also into broader business risks. For C-level executives, understanding how software test metrics evolve ensures that quality assurance metrics are not treated as vanity numbers but as software quality metrics that drive measurable business value.
How to Choose the Right Metrics to Monitor Software Testing and Quality?
Choosing the right software testing metrics requires selecting indicators that provide actionable insights for business decisions, rather than simply collecting numbers. Executives need metrics that connect software quality to customer outcomes, operational efficiency, and strategic priorities. Here is how to choose the most crucial metrics for testing as a tech executive.
1. Align metrics with business goals
Start by identifying the key objectives for your organization, such as customer satisfaction, release predictability, or operational resilience. Metrics should reflect these goals. For example, if user trust is critical, then escaped defects, customer-reported incidents, and uptime become essential metrics to monitor.
2. Focus on leading indicators, not just lagging ones
While historical defect counts and test execution rates are important, leading indicators like mean time to detect issues, coverage of critical workflows, and deployment frequency help anticipate risks before they impact customers. Tracking these allows executives to take proactive rather than reactive decisions.
3. Balance technical and business impact
Choose metrics that bridge the technical health of the product and the business consequences of quality issues. Metrics like customer adoption rate, cost of quality, and system reliability provide insights into both engineering effectiveness and strategic performance.

4. Prioritize simplicity and clarity
Executives are most effective when dashboards highlight a small set of high-value metrics. Avoid overloading leadership with detailed technical data. Instead, focus on metrics that provide clear signals and support decision-making, such as defect escape rate, mean time to recovery, and key user journey coverage.
5. Review trends over time
A single snapshot rarely tells the full story. Track trends across releases and quarters to see whether quality is improving, stable, or declining. Many tech leaders, including Sergio Oliveira from DesignRush, emphasize that trend analysis combined with qualitative insights from teams transforms raw data into strategic guidance.
6. Use the right tools and dashboards
Implement automated dashboards and integrated QA reporting tools to collect, visualize, and interpret metrics. Dashboards should consolidate data from test management systems, CI/CD pipelines, and observability platforms, enabling executives to make data-driven decisions efficiently.
Turn metrics into strategic insights: Meet a QA partner who fully understands your needs.

Examples of Software Test Metrics C-Level Specialists Should Know
With dozens of metrics being used every day by testing teams, the amount of data to keep up with can get overwhelming. The good news is that as an executive, you don’t have to keep track of each one that is used by your team. Here are the metrics that play a particularly important role in the quality process at the executive level.
Defect escape rate
Measures the percentage of defects that reach production undetected. This metric provides insight into the effectiveness of the testing process and highlights potential risks for customer satisfaction or revenue.
Mean Time to Recovery (MTTR)
Tracks how long it takes to resolve incidents or system failures. Executives monitor this to understand system reliability and operational resilience.
Test coverage on critical features
Indicates the percentage of business-critical workflows and test cases executed during testing. This software testing metric ensures that high-impact areas are consistently verified, whether via manual testing metrics or test automation metrics.
Cost of quality (CoQ)
Captures the total cost of preventing, detecting, and fixing defects, including rework and QA resource allocation. Monitoring CoQ aligns engineering efforts with strategic business value and helps prioritize investments.
Customer experience quality index (CXQ)
An aggregate measure of usability, performance, and error-free transactions. It serves as a leading indicator of adoption, churn, and overall software quality.
Deployment frequency and cycle time
Tracks how often new features or fixes are released and the duration of the test cycle. This metric informs whether development and testing are keeping pace with business demands, helping executives balance speed with stability.
Defect density and severity
Measures the number of defects per code unit and their impact. It helps assess manual testing and automated testing productivity measures. Tracking defect density by module or feature supports prioritization in software testing and quality improvement.
System uptime and reliability
Monitors the availability of critical systems or services. High uptime and reliability are essential for customer trust, especially in regulated or mission-critical environments.
Test case effectiveness
Evaluates the percentage of test cases that identify defects. This metric helps executives understand the efficiency of the testing process and whether QA efforts are targeting the right areas. It is particularly useful for improving manual testing metrics and software test metrics calculation.
What Are the Common Pitfalls in Software Test Metrics Calculation?
Even the best quality metrics in software development can be misleading if they are calculated or interpreted incorrectly. C-level leaders need to understand common pitfalls so that metrics provide real insights rather than false confidence.
Focusing on quantity over quality
Tracking the number of executed test cases or total defects without considering their impact can create a distorted view of software quality. Metrics like defect density or test coverage are more meaningful when aligned with business-critical features rather than all tests equally.
Ignoring context and derivative metrics
Raw numbers don’t tell the full story. For example, a rise in defects might be due to new functionality rather than declining quality. Derivative metrics, such as defect severity index or escaped defects per module, help identify underlying trends and give executives actionable insights.
Mixing manual and automated testing data without distinction
Manual testing metrics and test automation metrics differ in speed, coverage, and reliability. Combining them improperly can obscure whether issues arise from the test process, the software itself, or limitations in automation.
Overlooking lifecycle and phase variations
Metrics calculated at a single point in time can be misleading. The test metrics life cycle evolves as software moves from development through QA to production. Ignoring phase-specific considerations, such as differences in test execution efficiency between pre-release and production, can distort performance assessments.
Failing to tie metrics to business outcomes
Metrics are only valuable if they inform strategic decisions. Tracking technical indicators like test case effectiveness or test coverage without linking them to customer satisfaction, revenue, or adoption reduces their relevance for executives.
Inconsistent or incomplete data
Poorly integrated tools or fragmented reporting can result in gaps or errors. Metrics calculated from incomplete test execution logs or partial software QA metrics fail to reflect the real health of the software testing process.
Misinterpreting trends
Single spikes or drops, such as temporary increases in defect density, may not indicate systemic problems. Leaders should focus on long-term trends, comparing metrics across testing phases and releases to understand the effectiveness of the testing process.
Not sure where your QA process stands or how to improve it?
Our QA consultants are here to help

Best Practices for Monitoring Fundamental Software Testing Metrics at the C-Level
Monitoring fundamental software testing metrics effectively allows executives to align QA efforts with business strategy and ensure that software testing and quality deliver real value. The following practices help C-level leaders track the right metrics while avoiding common pitfalls.
1. Focus on metrics that matter to the business
Not every software test metric is relevant at the executive level. Prioritize metrics that impact revenue, customer satisfaction, and operational efficiency, such as defect escape rate, MTTR, and system reliability. Metrics like test automation metrics or manual testing metrics, on the other hand, are useful when they directly inform strategic decisions.
2. Use dashboards to consolidate insights
Centralize software QA metrics in a single executive dashboard. This allows leaders to monitor software testing productivity measures, test coverage, and defect trends at a glance. Incorporate both manual and automated testing results to get a complete view of the testing process.
3. Track metrics across the test lifecycle
Consider the test metrics life cycle: from planning, design, and execution to defect resolution and post-release monitoring. Tracking the progress of the testing process and completion of testing activities across phases helps executives understand both testing efficiency and the effectiveness of the testing process.
4. Align metrics with strategic goals
Metrics should not exist in isolation. Map metrics for testing to business objectives and KPIs, such as customer retention, product adoption, or regulatory compliance. This ensures software quality metrics inform business decisions rather than just technical reporting.
5. Automate data collection and reporting
Implement automation to capture executed test cases, defect counts, test coverage, and test execution rates. Automated tracking reduces manual errors and provides near-real-time insights, improving software testing metrics calculation and decision-making speed.
6. Review metrics regularly and iteratively
C-level executives should review QA testing metrics during regular planning cycles, not just at the end of a project. Observing trends over multiple releases allows leaders to spot early warning signs, optimize testing efforts, and balance test automation vs manual testing investments.
7. Create context with qualitative insights
Numbers alone rarely tell the full story. Combine metrics with team feedback, user experience data, and customer-reported defects. These metrics help assess whether the software is ready, the effectiveness of the testing process, and whether metrics provide insights that drive actionable improvements.

Final Thoughts
Software testing metrics are essential for C-level specialists because these indicators reveal how software quality impacts customer satisfaction, operational efficiency, and strategic priorities. Focusing on product, project, and process metrics helps executives understand the health of both the software and the development workflow.
Regular review of trends, combined with qualitative insights from teams and users, ensures metrics reflect meaningful outcomes. When aligned with business objectives, these metrics guide decisions, optimize resource allocation, and support the delivery of high-quality software products that drive long-term value.
Frequently Asked Questions
 Why should executives pay attention to software testing metrics?
These metrics are important for executives because they connect engineering performance to business outcomes. They highlight risks, resource needs, and readiness for release, giving leadership confidence in decision-making.
What’s the difference between metrics for QA teams and metrics for executives?
QA teams track detailed measures like individual defect logs or test execution counts. Executives need higher-level insights, such as defect escape rate, cost of quality, or customer satisfaction, which link testing performance to business results.
Which single metric is the most important for executives to track?
There’s no universal “one metric.” For many companies, it’s defect escape rate, uptime, or MTTR, but the right choice depends on business priorities — customer trust, speed to market, or compliance.
How often should executives review software quality metrics?
At minimum, metrics should be reviewed during quarterly planning and before major releases. Many organizations also include them in monthly or even weekly executive dashboards.
What role does automation play in quality metrics?
Automation makes metrics more accurate and timely. For executives, automated dashboards reduce manual reporting and give a near real-time view of software health.
Jump to section
Hand over your project to the pros.
Let’s talk about how we can give your project the push it needs to succeed!