Have you ever wondered why two near-identical websites or applications with about the same set of features have dramatically different load times, resource utilization, and error rates? Or maybe you yourself encountered an eCommerce store that worked great on any average day but on Black Friday which you have been waiting for so long just suddenly went down, and you couldn’t make a desired purchase? Well, it’s all about performance.
Performance is the difference between a middle-of-the-road app and a great app. At the end of the day, vetting the app from bugs isn’t the only goal of product development. To deliver a usable product that would appeal to end users, it’s essential to invest time in ensuring it seamlessly works across all browsers and devices and can withstand peak times when thousands of people start flowing to your site.
Words by
Maksym Khymii, Automation QA Team Lead at TestFort
“Performance testing is as important as functional testing. It should never be underestimated as it helps you determine the performance limits and the levels at which you need to improve performance indicators if necessary. This applies to both the code and hardware parts of the solution.”
There are thousands of different testing approaches, types, and techniques used in software quality assurance, but performance testing, without a doubt, is one of the most critical ones to the long term success of your software solution. In this article, we’re going to cover the basics of performance testing, including its types, tools, key metrics, and advantages as well as how it differs from other testing types. Ready to start? Let’s jump in!
Key Takeaways
Performance testing is crucial for preventing slowdowns and crashes, especially during unexpected peak times. While it’s essential for any software, it’s even more critical in industries like finance, healthcare, and manufacturing, where even the slightest delay can lead to serious consequences.
Performance testing is often mixed with performance engineering, but these are two different things. The main difference between them is the concept. While performance testing is mainly focused on running tests in a controlled environment, performance engineering takes a broader approach and aims to design solutions that avoid potential bottlenecks from the get-go.
No software development should go without running performance tests. Testing the product against abnormal conditions is essential to ensure it won’t fail due to the spike of traffic or any other unexpected issue once it goes live.
The benefits of performance testing are numerous, from cost savings due to the lack of the need for major rework down the line to better scalability, better user experience, and more conversions as a result.
There are many different types of performance testing that address various aspects of software solutions. These include load, stress, endurance, spike, volume, configuration, and scalability testing.
When running performance tests, QA engineers focus on several key metrics, which can be grouped into three categories: how fast it can go, how far it can go, and how long it can keep going for.
While QA performance testing is a crucial part of the SDLC, it should be approached strategically. Instead of trying to cover every possible usage scenario, which might not always be necessary, it’s more effective to focus on the most probable use cases and use resources wisely.
What Is Performance Testing?
Performance testing, or application performance testing, is just what it sounds like. It’s the type of testing used to assess the performance of an application or website under specific conditions, such as different traffic loads, network environments, and data volumes. The goal of this testing is to see how the app behaves in varying environment conditions and address potential bottlenecks before they get a chance to impact the app’s performance after release.
Let’s say you are developing an eCommerce app. Before your app can be delivered to the public, it will need to go through a number of performance tests to ensure that everything, from visuals and texts to core functionality like checkout processes and payment gateways, runs smoothly under different usage scenarios.
Here’s what performance tests need to check out:
If the app loads at the same speed across different devices/browsers/operating systems;
All visuals and texts are loaded correctly and are fully functional on all devices;
The app can handle a large number of users without experiencing slowdowns, crashes, or errors;
There are no memory leaks or resource overuse that could cause system slowdowns over time;
If a glitch occurs, the app can recover without losing data or user progress.
Words by
Igor Kovalenko, QA Lead at TestFort
“First impressions depend on how fast a product works, while performance ensures that this impression is a good one.”
Why Conduct Performance Testing
The role of performance testing is incredibly important for building a high-quality software solution. These days, with such an abundance of apps out there, users are not as tolerant as they used to be even a few days ago. A minor glitch or delay in the app’s load speed would be enough of a reason for most of them to just leave your site and go for your competitor. This is us not even talking about critical industries like finance and healthcare, where performance issues can lead to much more severe circumstances, from lost money to delayed or incorrect treatment due to miscommunication.
That’s where software performance testing comes in. By evaluating how your app performs under various circumstances, you can mitigate many issues that could frustrate your users, reduce bugs, and ensure your product is reliable and stable no matter what. You will also get peace of mind knowing that whenever you decide to scale, your app will easily handle increased traffic without compromising performance.
Words by
Igor Kovalenko, QA Lead at TestFort
“Performance testing doesn’t just measure, it also enables systems to function under load.”
Real Cases of Performance Testing Failures
You’d be surprised just how often companies, big ones included, compromise software testing in the rush to roll out a new product or feature. Many either skip testing entirely or rush through it without taking the time to thoroughly test the performance and load-bearing capacity of the product. The result? Software solutions that could have been great are abandoned due to crashes or critical downtime.
Here are just a few examples of what can happen when QA performance testing is ignored or not fully implemented.
Major payment delays
In the UK, major banks like Barclays, Santander, RBS, and Natwest experienced severe downtime due to a traffic spike. Customers couldn’t access their accounts, pay bills, or transfer money for a few hours. What went wrong? The systems simply couldn’t handle the surge in user activity, which happened on a payday.
Obviously, these banks are still functioning, but the impact from performance failure was quite big. Besides thousands of disgruntled customers who shared their complaints on social media, some banks were fined by FCA.
Glitch in digital banking
Another noteworthy case involved Lloyd internet banking. A minor glitch in the system caused over 3,000 ATM machines to go offline, leaving countless customers unable to use their cards or withdraw cash for over three hours. They later admitted that this glitch was due to a server failure, which shouldn’t have happened as there had been no major build or update to the system.
These are just two examples of performance failures in the banking sector, but similar issues can be found in many industries. Take HealthCare.gov, for example – another big player with a huge customer base. Over the last few years, customers have complained about the functionality of their website a lot of times, blaming it for constant lags and glitches.
It’s good they don’t deal with prescriptions, but if they did, the consequences would be much worse than just complaining. All this just goes to show how important it is to test systems and do it rigorously. A minor bug can be the start to reputational damage, loss of customer trust, fines, and even legal procedures.
How Does Performance Testing Differ from Performance Engineering
Performance engineering and performance testing are two terms that are often used interchangeably, but are they the same thing? No, they are not. Not only do these methods differ in their purpose and scope but they are also different in terms of activities they cover. Let’s take a look at the key differences between them.
Scope
Performance testing focuses on identifying issues in software solution by running tests in a controlled environment. The goal is to assess specific performance metrics such as response time, throughput, and stability under various load conditions.
Performance engineering, on the other hand, takes a broader and more proactive approach. It’s a continuous process integrated throughout the SDLC, which, in addition to testing, also aims to design, develop, and optimize software to meet performance goals from the ground up. It considers architecture, infrastructure, and design to ensure performance is built into the product, not just tested afterward.
Goals
The primary goal of performance testing is to detect any performance issues that could impact the app’s behavior and fix them before release. When it comes to performance engineering, its goal goes beyond just finding problems with the product’s performance. First and foremost, it’s about ensuring that these problems don’t even happen by designing and developing software that can handle load and scale.
Timing
There’s also a difference in timing. While performance testing is usually conducted closer to the end of development, or just before production, performance engineering starts early and doesn’t end until the product is launched. From planning and designing through developing, testing, and monitoring, it’s running like a red threat through every stage of the SDLC.
Examples
Let’s take an eCommerce website as an example. In this case, performance testing would be focused on running load tests to ensure the app can handle a flash sale with 10,000 or more concurrent users.
With regard to performance engineering, its focus would be placed on designing the eCommerce website’s architecture, using caching mechanisms, load balancers, and optimizing database queries, to ensure it can handle traffic spikes and work under load without crashes or slowdowns.
Performance Testing vs Continuous Performance Testing: How They Compare
Another type of testing that many mix up with performance testing is continuous performance testing. Let’s see how they compare to each other to understand the difference between the two.
Scope
Performance testing focuses on specific scenarios (load, stress, spike tests), whereas the focus of continuous performance testing is much broader. As the name suggests, this methodology extends throughout the entire software development life cycle, continuously monitoring product performance as any changes are made.
Goals
The purpose of performance testing is to evaluate how the app behaves under various conditions, such as heavy loads or stress, at specific points in the development cycle. It seeks to identify bottlenecks, stability issues, or performance degradation right before release. Continuous performance testing approach, on the other hand, is focused on ensuring that performance issues are continuously monitored and addressed throughout the development lifecycle. The goal is to prevent issues from creeping in as new features or updates are introduced.
Timing
Unlike conventional performance testing, which is conducted at specific intervals, continuous performance testing is carried out throughout the entire SDLC, from early stages where developers only start writing code to the moment of launching a final version of the product.
Examples
As an example, let’s take the same eCommerce website. With product performance testing, you’d be simulating a situation in which a website would have to deal with heavy traffic, such as, for example, during Black Friday event when thousands of users shop online. In contrast, continuous performance testing will allow you to check how your site responds to every single change made to the code, making it possible to predict whether it will be able to handle flash sales and whether it’s not going to degrade over time.
Here’s a detailed breakdown of the key distinctions between these three methodologies.
Aspect
Performance testing
Performance engineering
Continuous performance testing
Scope
Focuses on evaluating the system’s behavior under specific conditions (e.g., load, stress, spike).
Covers the entire software lifecycle, aiming to design, develop, and optimize for performance from the ground up.
Monitors performance throughout the development lifecycle, continuously assessing and ensuring stability.
Goal
Identify performance issues such as slow response times, bottlenecks, or crashes just before deployment or release.
Ensure performance is built into the system architecture, focusing on preventing issues before they arise.
Continuously identify and resolve performance degradations or regressions during every phase of development.
Timing
Conducted near the end of the development process, usually right before production or after major updates.
Integrated from the very beginning of the SDLC and continues through to production.
Integrated throughout the entire development lifecycle, from early coding to production, as part of CI/CD pipelines.
Frequency
Occurs at specific stages (e.g., before product release or after major updates) or on-demand before high-traffic events.
Ongoing, as performance is optimized and built into the design from day one.
Continuous, with performance being assessed after every code change or deployment to ensure no regression.
Who conducts
Typically conducted by a dedicated team of QA engineers.
Conducted by performance engineers or architects who are involved throughout the SDLC.
Conducted by development teams, DevOps engineers, or Site Reliability Engineers
Key metrics
Response time, throughout, resource usage, and stability under load.
System scalability, optimization of architecture and infrastructure, resource efficiency, and maintainability.
Real-time performance metrics like response times, latency, throughput, error rates, and overall system stability post-deployment.
Benefits of Performance Testing
Performance testing is an essential part of the testing cycle, ensuring the smooth functioning of the software. If done right, it can bring a number of significant benefits. Let’s go over some of the key advantages of performance testing to understand why you should focus on it, and how it can help your business grow.
Enhanced user experience. Users expect fast and responsive software, and performance testing helps deliver on these expectations. Faster load times, reduced downtime, and a seamless user experience lead to higher satisfaction, which can increase customer loyalty and reduce churn.
More conversions. When users love the app, they are more likely to engage with it more often, leading to increased conversions. Whether it’s making a purchase in an eCommerce app or using a service, a smooth performance directly impacts user engagement.
Better scalability. As your business grows, so do the demands on your software. Performance testing ensures that your app can scale easily by assessing how well it handles increased traffic and data volumes. This allows you to plan for future growth without worrying about performance bottlenecks or system instability.
Lower maintenance costs. While testing might seem an expensive overhead, it ultimately saves money in the long run. Performance testing, in particular, helps catch and fix performance-related issues early on. That way, if any issues arise, they can be addressed during the development phase rather than waiting until production, where the cost of fixing bugs or downtimes jumps several times.
Improved competitive edge. These days, having an app isn’t enough to maintain a competitive edge. In order to stay afloat and see your business thrive, it’s vital that the app can not only retain users but also attract new ones. The best way to do this is to offer people a well-performing app that runs smoothly in different environments.
Types of Performance Testing
There are different types of performance testing such as load, stress, endurance, spike, volume, configuration, and scalability testing. While load testing and stress testing seem to be the most common ones, each and every type of performance testing sets to discover and eliminate different specific performance-related issues.
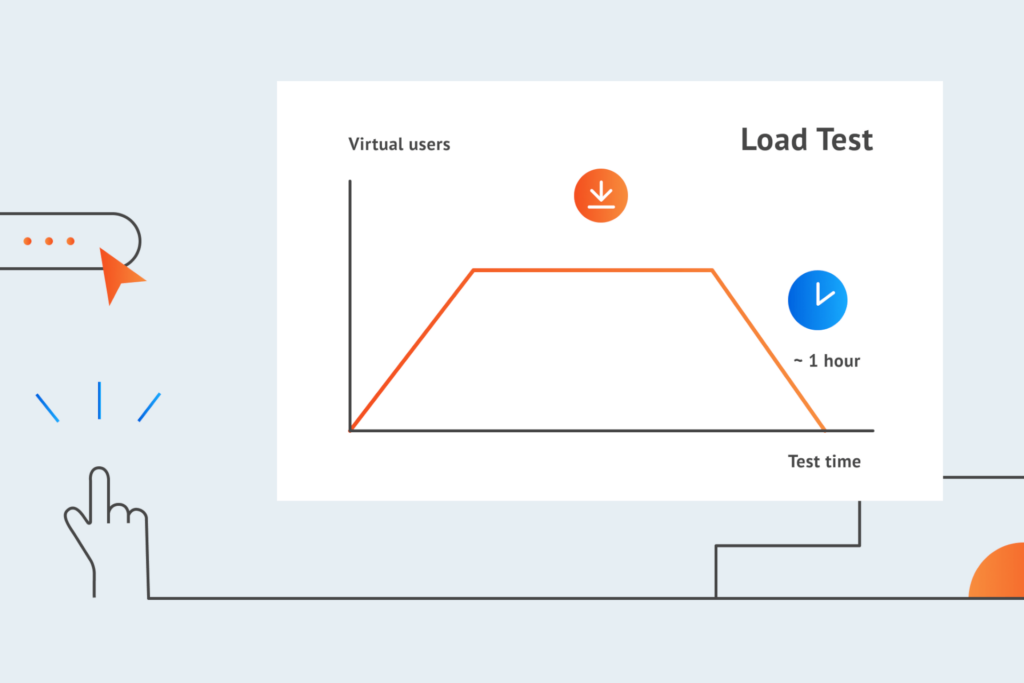
Load testing
Let’s start with the simplest yet most common type of performance testing called load testing. In load testing, your main goal is to analyze the behavior of your website or application under different load conditions. Be it simulating a load of transactions expected within a set time period or a specific number of users trying to access your software solution at the same time, this type of performance testing will help you measure the speed and capacity limits of your system under various expected load conditions.
Let’s assume we’re a mid-sized company running an eCommerce website. With around 500 concurrent users on an average day, our online store is doing pretty good in terms of performance, responding to user actions such as browsing through categories, loading product pages, and adding items to cart within an acceptable response time of 1-3 seconds. And since there are no page errors, our customers are happy with their shopping.
But come a holiday such as Christmas with a load of 5,000 concurrent users, and all of a sudden our customers are faced with discouraging experiences of sluggish response times, page crashes, and failed checkouts. Why? Because we either completely forgot, or didn’t even care to conduct load testing. We didn’t have a clue if our system could effectively handle this many concurrent users and simultaneous transactions. We didn’t prepare our website for holiday traffic and faced considerable losses in revenue and customer loyalty as a result.
The purpose of load testing is to prevent situations such as in the example above. It enables you to identify performance bottlenecks of your system and the hardware running it to help you prepare the necessary capacity for expected loads well in advance. It gives you a clear understanding of:
the average response time of each transaction in your system;
the peak number of users your system can effectively handle within set performance parameters;
bottlenecks such as CPU, memory, and network utilization in your system;
whether the existing hardware and server configuration deliver on performance requirements.
Check out how our team approached testing a project with two versions that required multiple environments and different auto tests
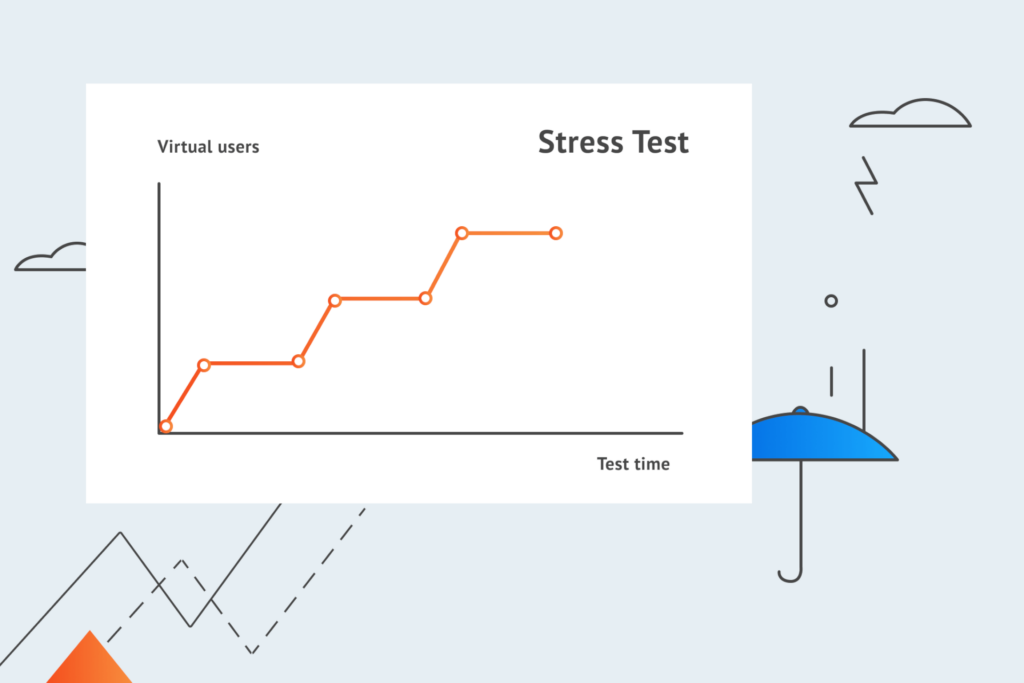
Unlike load testing that focuses on measuring the performance of your system within the normal/expected load conditions, stress testing goes well above the expected maximum in the number of concurrent users and transactions. The purpose of stress testing is to put your website or application through hell and high water in order to assess stability and analyze system behavior under extreme loads.
In the course of stress testing, your software solution is continuously bombarded with an increasing number of virtual users and transactions in order to see:
how well your system will handle these extreme conditions;
at what point the system and its components will finally fail;
how long it will take for your software solution to recover.
It is vital to identify these breaking points and ensure that your system is well prepared to deal with all and any extreme conditions that could put your entire business at risk. This is especially important for social networking websites, email services, fintech solutions, and eCommerce platforms—businesses that deal with huge amounts of traffic and/or handle sensitive user data.
Stress testing helps you to:
determine the limits of your system in the number of users and transactions it can handle before it breaks;
optimize data handling to avoid things such as memory leaks or permanent damage to business/user data;
identify vulnerabilities and take precautionary measures against possible security threats that could be caused by extreme load conditions;
improve the way your software solution handles errors and reports on them in terms of user experience.
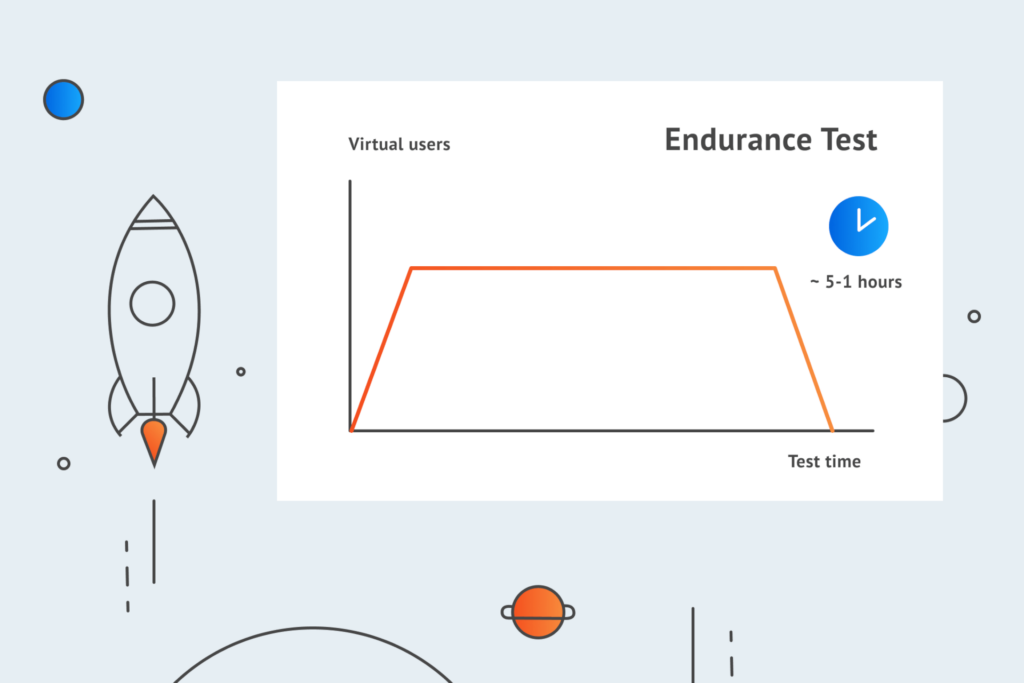
Endurance testing
The purpose of endurance testing (also known as soak testing or longevity testing) is to check whether your website or application can sustain a predetermined workload for an extended (also predetermined) period of time. Much like in stress testing, the load volume is usually a lot higher than in the system’s normal working conditions. This enables you to see what would happen to your software solution in case of a continuous load that is outside of the system’s design expectations.
The important thing soak testing helps you understand is that there can be a huge difference between subjecting an application to a specific load for an hour against tiring it out for an entire day. It may not be a problem for software solution designed for a thousand concurrent users to handle five thousand for a couple of hours, but give this continuous load a day and your entire system may fall along with its infrastructure.
Let’s take a banking application at the closing of a financial year for an example. These fiscal year-end procedures are a pretty lengthy stress fest finance teams devote enormous amounts of time and energy to. It takes a company a week on average to close their financial statements. During this extended period the banking application should expect at least two times the normal load. And it is the bank’s job to make sure their systems provide an appropriate handling capacity so that their customers do not face any lag, crashes, or other abnormal system behavior.
Determining how your system behaves under sustained use will help you:
identify performance degradation in terms of response times and/or throughput of your system;
analyze memory utilization to detect potential memory leaks and other memory management issues;
discover database connection and resource utilization issues under sustained use of the system.
QA Audit and Process Optimization for Drone Software
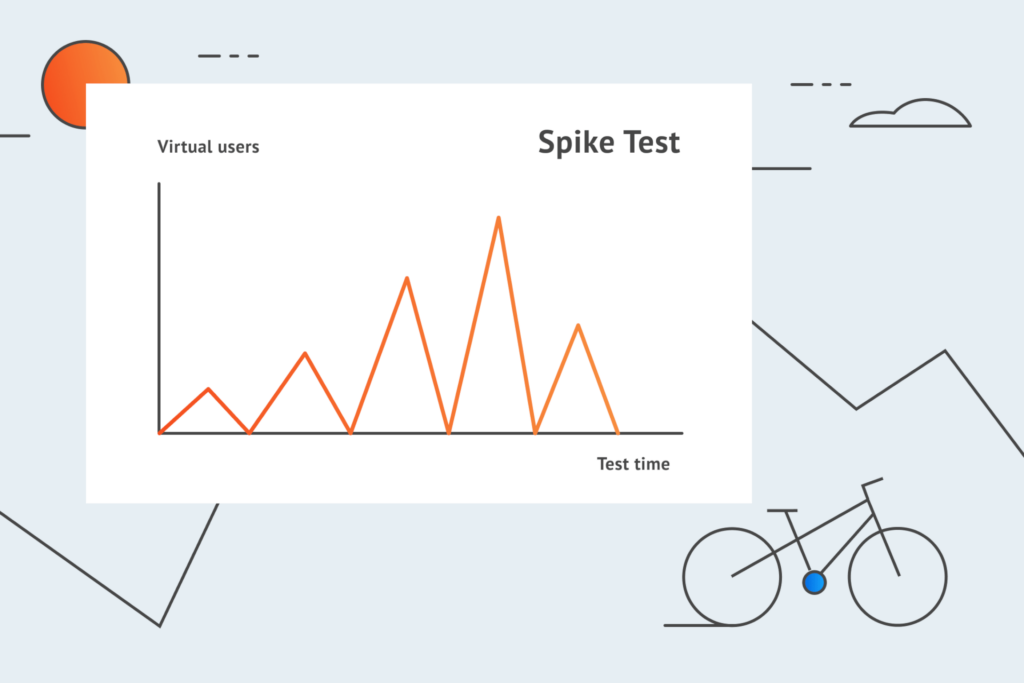
Instead of subjecting software solution to a specific continuous load (as they do in soak testing), spike testing is all about observing the performance and behavior of the system under sudden substantial increases and decreases in the number of users and/or transactions in the system. The goal of these quick and repeated spikes is to:
determine whether the system can effectively handle drastic load changes that fall beyond its normal conditions or it will suffer serious performance degradation and fail;
determine the recovery time of your system between two and more successive load spikes in case of a system failure;
help you prepare your system for plausible bad to worst-case scenarios that should never be ignored.
This time let’s imagine a live-streaming application during, say, the Super Bowl, one of the world’s most-watched sporting events. Since Super Bowl ads have become a cultural phenomenon of their own, on average the Super Bowl event takes around 4 hours from start to finish with ad breaks amounting to a total of 50 minutes.
During these ad breaks, a gargantuan number of users may log in and out of the system simultaneously, causing huge load spikes that your system should be ready to handle like a champ. Otherwise, possible performance deterioration or, perish the thought, complete system failure could lead to an outrage that would really hurt your live-streaming business both financially and reputation-wise.
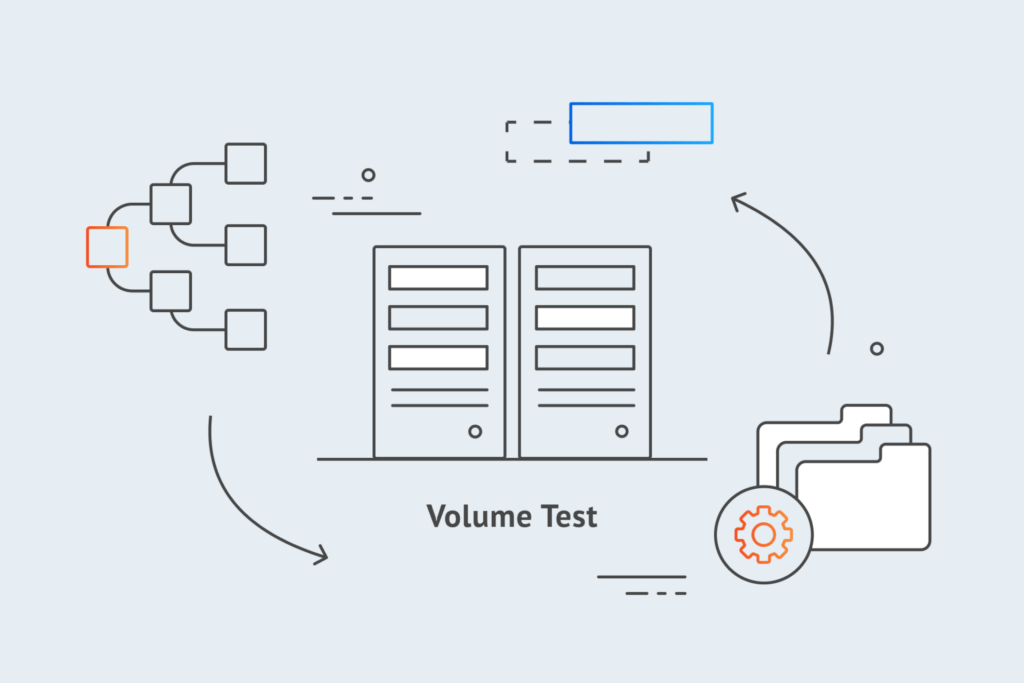
Volume testing
In comparison to the previously described types of performance testing that focus on user traffic and changes in transaction loads, volume testing is used to analyze your system’s ability to effectively handle large volumes of data. It is also commonly called flood testing because you literally flood your database with data to see its impact on the behavior of your website or application.
Imagine a worldwide challenge where millions of people are straight off rushing to upload their videos to your social media platform. This puts a huge burden on the database that your social networking website and mobile app are communicating with, sending and calling these enormous volumes of generated data at the same time. Your job is to make sure that your users can upload and view these millions of videos without facing any timing out or data loss. And thus, you need to identify bottlenecks in your database-system communication and determine the capacity before such a scenario comes down on like a bolt from the blue.
In addition to assessing the performance of your database in terms of response time and data handling, volume testing enables you to:
identify the data processing threshold of your database and the extreme point at which the systems will fail
find out the issues with communication between the servers in your database when there is more than one server involved
optimize data processing and the costs of maintenance of your database infrastructure
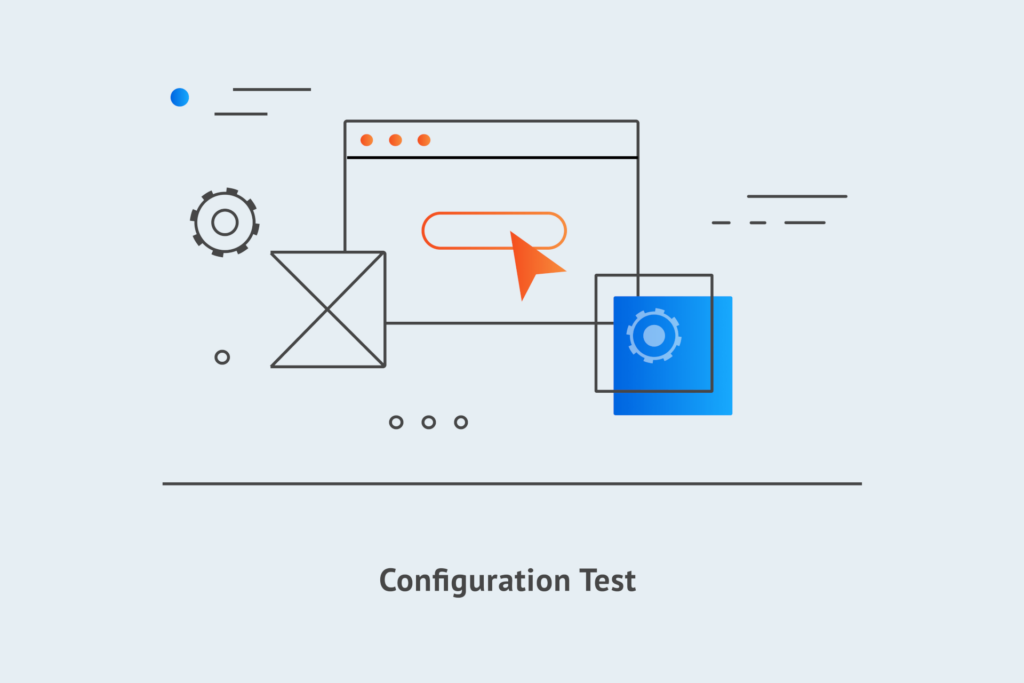
Configuration testing
In configuration testing, quality assurance engineers experiment with each and every combination of supported hardware and software in order to determine the effects of configuration changes on system components and identify the system configuration that works without issues and matches its non-functional requirements best. This data is also used to improve the overall performance and behavior of your website or application under all possible other configurations.
The different configurations include various combinations of supported software components such as operating systems, drivers, and browsers with pieces of hardware like CPU and RAM on three different platforms:
Server platform (e.g. Windows Server, Ubuntu Server)
Database (e.g. MySQL, IBM Db2, Oracle Database)
It is a time-consuming type of performance testing that requires installation and constant setting up of numerous software components on various physical devices you use for testing. Yet it’s also a very important one since it will help you:
analyze system performance by adding, removing, or modifying components to determine the optimal configuration of your application under test
verify optimal system performance in a geographically distributed environment where clients and servers are in different locations
discover defects and vulnerabilities that could not be identified by other types of performance testing
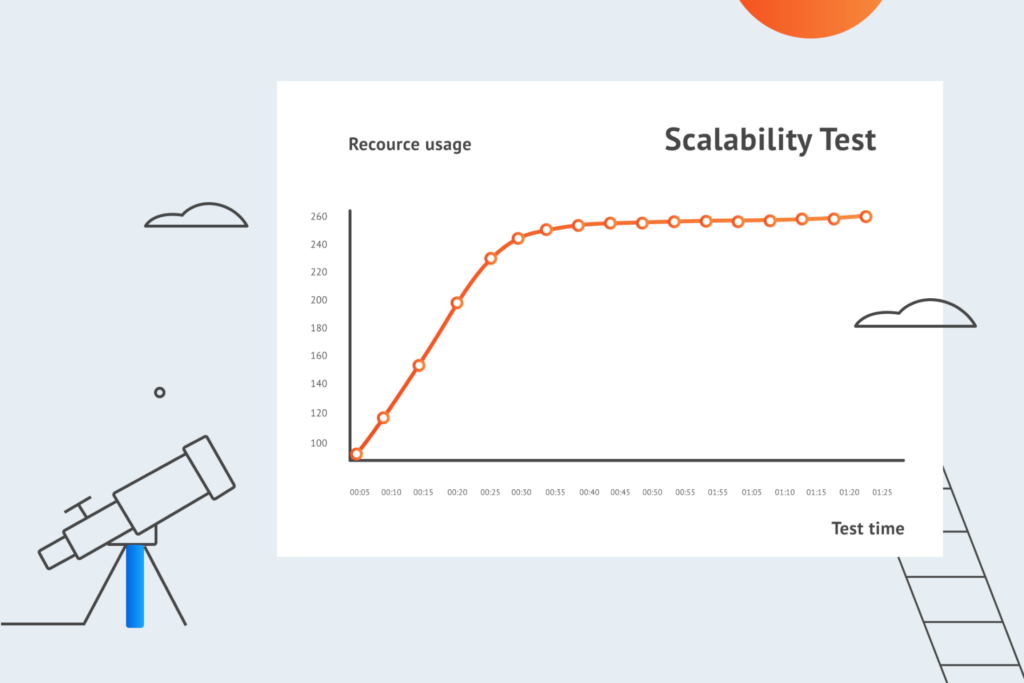
Scalability testing
As the name suggests, scalability testing is responsible for measuring the capability of your system to scale up or scale down in terms of its performance attributes. This type of performance testing helps you test the upper limits of your system’s scalability and assess its capability to meet your growing business and/or technical needs.
Scalability testing can be performed at software, hardware, and database levels. The testing parameters may also differ depending on the kind of solution you’re testing. Whether it’s a website, web/mobile application, a desktop solution, or a web server, a scalability test may consist of numerous performance measurements, including response time, throughput, number of users, number of requests processed as well as network, CPU, and memory usage.
Scalability testing is carried out by subjecting the system to continuously increasing loads of traffic and data in order to monitor the performance over a period of time. Once the scalability limits are measured, the development team can start working on appropriate solutions to ensure that the system can show good performance beyond that point.
It may seem very similar to what stress testing and soak testing are trying to achieve. However, instead of determining the point at which your website or application would crash, scalability testing is focused on identifying the reason why the crash happened and taking steps to resolve this performance issue.
Performance Testing Metrics
Now that you’re acquainted with every type of performance testing and the purpose they serve, it’s time we explained some of the key parameters quality assurance engineers monitor when conducting performance testing. The measurements and calculations we call metrics in performance testing metrics help you understand the quality and effectiveness of your development efforts. It’s the valuable data your software development team will use to introduce improvements to your software solution and optimize its performance.
Since there are too many different performance attributes you would want to measure, one round or type of performance testing would not be able to cover them all at once. Therefore, it would be wise to ask yourself these three important questions when planning your performance testing:
How fast can it go?
How far can it go?
How long can it keep going for?
Now let’s use these very questions to break down the performance testing metrics into logical categories.
How Fast Can It Go?
Response time
Response time is the total amount of time it takes your system or one of its functional components to respond to a given input. It is the elapsed time between an inquiry for a service and the response to that inquiry. This can be anything from loading a web page to a complex database query. In performance testing, we usually measure the average and peak response times. The lower the response time is, the better.
Load time
This means calculating the average amount of time it takes for your system to deliver on an inquiry from initiation to completion. The simplest example would be loading a web page and calculating the time it takes from clicking on a page link to when it’s fully loaded in your browser.
Throughput
Throughput is usually measured in transactions per second (TPS) and shows the number of transactions your system can handle over the test duration. Even though we’ve put this parameter in the speed section, throughput can also be used to determine the capacity of the application under test and the ability of the server in terms of how much load it can take. In any scenario, the purpose is to achieve the highest level of throughput.
Requests per second
Requests per second (RPS) show the number of requests sent to the web server by your users in one second. It should never be confused with throughput that deals with transactions per second. The huge difference between the two metrics is that one transaction can be a whole group of requests, which means that a single transaction can create multiple hits on the server.
Words by
Maksym Khymii, Automation QA Team Lead at TestFort
“If, for example, on the client side your solution produces a lot of unnecessary, irrelevant requests to the server (pings, retries, etc.), you should find the reason and try to significantly reduce the number of these requests in order to reduce the load on the server. Otherwise, you risk locking the databases and timing out your users.”
Network bytes total per second
This metric tells you the total number of bytes received and sent over a specific network connection per second. It is used to calculate utilization of your networks and interfaces to ensure good throughput.
Network output queue length
Network output queue length is used to identify and address delays and bottlenecking in your system. This metric shows the output packet queue in your network. And if the queue is longer than two packets, this means there is a bottleneck you need to find and eliminate in order to improve the performance of your system.
Garbage collection data
Garbage collection metrics serve to help your memory management efforts. It is used to analyze the quality of your solution’s automated memory management and see how effectively it returns the allocated memory it no longer needs back to the system. This metric helps the development team address memory-caused instability of the system.
How Far Can It Go?
Concurrent users
The term refers to the number of users engaged with your website or application at the same time (or for a predefined period of time). This is one of the most common metrics for load testing as it helps to keep your system performance from degrading due to the complexity of processing requests from a number of users beyond the normal working conditions. While similar to requests per second, the difference is that each concurrent user can generate a high number of requests.
Performance quality that stands out! We will take your solution to hell and back to bring the performance to its finest
Bandwidth is used to assess the capacity of your system in terms of the maximum amount of data that can be transferred per unit of time through a communication channel. It is usually measured in bits per second used by a network interface.
Resource utilization
As you can easily guess, resource utilization metrics show you how much hardware resources your system needs to perform well.
CPU usage shows you the amount of time a processor on a specific device spends to process a certain request.
Memory usage indicates how much physical memory is needed to process a request on a specific device.
Storage usage shows how well the available data storage space on a given device is utilized by your system.
Latency
Latency indicates how long it takes from the moment a request is sent by a user until the first byte is received by the server. Simply put, it’s the travel time from client to server and server to client. This metric is mainly used to address lag issues in your system. The measuring units for latency are normally milliseconds, but it can also be measured in seconds, minutes, or hours.
Private bytes
Private bytes metrics serve to measure the number of bytes a specific process has allocated that can’t be shared among other processes. These measurements are a great means of tackling issues related to memory management such as memory leaks.
How Long Can It Keep Going For?
Error rate
Error rate measurement helps you compare the number of requests resulting in errors to your total requests in order to calculate the percentage of problematic requests. It goes without saying that the error rate in your system should be minimized if you want to achieve high performance and improve user experience. However, it’s not uncommon for some errors to occur when the load exceeds the capacity of your system.
Maximum active sessions
Simple as it goes, this metric indicates the maximum number of sessions that can be active at the same time. Similar to concurrent users, when the number of active sessions exceeds the capacity of the system, it may have a negative impact on its performance due to the complexity of processing requests.
Transactions passed/failed
Expressed by a percentage, this metric indicates the total number of successful and unsuccessful transactions in the system. Combined with other data such as response times, and error rates, transaction pass/fail counts can help you discover system-related issues, incorrect configuration, or missing test data.
Committed memory
Committed memory refers to the maximum amount of virtual memory committed to support the system’s operation. This memory must be backed by either physical memory or the page file (a reserved portion of a hard disk) in order for your system to show good performance. In the scenario when the percentage of committed memory exceeds the sum of sizes of your physical memory and page file, your system may suffer crashes or other malfunctions. Therefore, it’s an important metric developers use to identify and fix memory management issues.
Page faults
A page fault happens when a process in your system is trying to access a page of memory outside of its working set by reading from or writing to it. Simply put, it’s when a process accesses memory it’s not allowed to, which causes a page fault. This can have a negative effect on the latency of certain memory accesses and create performance issues. To tackle these more effectively, it wouldn’t hurt to calculate the rate of these faults.
Thread counts
This metric is used to assess the number of sequential actions in the system that are currently active. The CPU can run the next thread waiting in line only after it finishes processing the previous one. Therefore, high thread counts are a bad sign in performance testing as they may lead to piled up requests that are waiting to be processed and, eventually, high error rates (such as timeouts).
Performance Testing Process
There is a huge variety of methodologies, techniques, and approaches that can be applied to calculate the metrics you learned about in the previous section and eliminate performance bottlenecks in your software solution. The general process of performance testing, however, remains the same regardless of the type of performance testing you want to execute.
Below is the standard performance testing process.
Identify the test environment
What are your current software specifications?
What are the hardware and network specifications of your production environment?
What performance testing automation tools would match those specifications best?
These are the main questions you need to answer when determining the physical test environment for your performance testing plans. When you have a thorough understanding of the hardware, software, and network requirements for your physical test environment early on in the SDLC, it enables your quality assurance team to plan and design significantly more efficient performance tests.
Determine Performance Acceptance Criteria
The next step is to determine what metrics will be used to implement your performance test strategy. This includes performance goals and constraints for parameters such as response time, throughput, and resource utilization. Identifying these plays a huge role in determining performance acceptance criteria from the system, business, and user perspective. The process can be made a bit easier if you find a similar project to compare to. This is a lot like the analogous approach in project cost estimation.
Plan and Design Performance Tests
Now that you have the requirements for your physical test environment and well established performance acceptance criteria, you can start working on the actual tests. To do this, you have to:
Identify the key scenarios for tests.
Determine how use cases are likely to vary depending on different representatives of your target audience.
Find most efficient ways to simulate this user variability.
Define test data and what metrics should be gathered from a particular test.
Consolidate this data into different system usage scenarios you want to validate.
Configure the Test Environment
The next step is to build your physical test environment, set up automation tools, and allocate the resources necessary to successfully implement your performance testing strategy. You need to make sure that your test environment configuration meets all of the hardware, software, and network requirements you’ve identified in step one before you can move on to implementing and executing the performance tests.
Implement Your Test Designs
With a physical test environment in place to run the tests, you can finally turn your test designs into actual performance test cases and scripts. Every test case will include concise information on the testing procedure, execution conditions (different workload scenarios), and expected results (including how they relate to business functions).
Execute the Performance Tests
Now it is time to run the tests. Monitor the test environment and the performance of your system and its components against different load conditions. Validate the gathered data and document the results into concise performance reports for further analysis.
Analyze, Optimize, and Retest
After you’ve consolidated the gathered data into concise reports, you can adjust the tests, compare the results, and work on ways to address the identified bottlenecks on the system, hardware, and network levels. Each round of retesting will help you introduce small adjustments to your test environment and systems until you’ve fine tuned the performance of your software solution to a desired level.
Words by
Maksym Khymii, Automation QA Team Lead at TestFort
“We provide our clients with detailed reports, in which we always put our suggestions on how the performance issues found could be solved. We communicate with developers, with devops, and show them which endpoints are the most critical and need to be fixed first. After the agreed fixes have been implemented, we, of course, do a retest to make sure that the identified issues are no more and the fixes did not lead to any new ones.”
Performance Testing Tools
Performance testing is impossible to do without proper automated testing tools. Depending on your performance testing needs, experience, and budget, there are numerous performance testing tools and frameworks available on the market. And even though there are lots of pricey options out there, the majority of tools quality assurance professionals use today are open-source and can be accessed absolutely for free.
Here’s a list of popular performance testing tools with their features, advantages, and possible drawbacks explained.
JMeter
Probably the most popular of all performance testing tools, Apache JMeter is an open-source Java application designed to measure the performance of web applications (and a variety of other kinds of systems since recent updates). It is used to simulate heavy loads on servers, networks, or system components to test and analyze their ability to perform well under different load types.
Some of its biggest advantages are:
the ability to performance test a lot of different static and dynamic resources out of the box, including Java Objects, HTTP/HTTPS, SOAP and REST web services, FTP, databases, queries, and mail protocols
a robust Integrated Development Environment that simplifies planning, recording, building, and debugging your performance tests
a flexible core that can be easily extended with a huge variety of readily available free plugins provided by the community
Although JMeter is one of the most popular performance testing choices, it still does have some shortcomings:
even though the UI is pretty intuitive, the learning curve to use JMeter effectively is still quite steep
it’s pretty resource heavy, and high memory consumption when executing large JMeter tests may cause errors
LoadRunner
JMeter, the tool described above, was pretty much built to serve as an open-source alternative to LoadRunner from Micro Focus, a highly sophisticated commercial tool for measuring system behavior and performance under load. While JMeter is primarily focused on performance testing web applications and services, LoadRunner features broader options, including testing of ERP software and legacy systems.
LoadRunner’s most distinctive features are:
native monitors which means there’s no need to install the tool on the server under test
excellent UI that enables you to monitor performance metrics in the form of concise, colored charts
ease of creating virtual users and no limitations on the number of virtual users when running the test cases
Except for the most obvious downside (which is the ridiculously high cost of a license), LoadRunner:
requires a ton of resources to work efficiently and avoid crashing
arranging scripts takes up a lot of time and resources, especially in the case of frequent changes to the build of your software solution
PFLB
PFLB is an AI-driven load testing platform designed to help teams simulate high traffic scenarios for websites and applications, ensuring their products are scalable and performance-ready. With its user-friendly interface and advanced capabilities, PFLB is an excellent choice for teams looking to optimize their performance testing processes.
Key Features:
Scenario-Based Traffic Simulation: Create realistic load testing scenarios to mimic real-world user behavior.
Production Load Profile Import: Seamlessly integrate with Google Analytics to import your production load profiles for accurate testing.
No-Code Scripting: Utilize an intuitive no-code editor to easily design and execute test scripts without requiring advanced technical expertise.
Advanced JMeter Execution: Scale and execute complex JMeter scenarios effortlessly.
AI-Powered Insights: Leverage AI-driven performance insights to identify and resolve bottlenecks effectively.
Grafana Dashboards: Visualize and analyze load testing results through comprehensive Grafana dashboards.
Supported Protocols: PFLB supports a wide range of protocols, including HTTP, HTTPS, gRPC, JDBC, JMS, AMQP, MQTT, and Kafka, making it versatile for various testing needs.
Gatling
Gatling is an open-source performance testing framework built on top of a toolkit called Akka. It is a highly capable tool that focuses on stress testing. Its biggest advantage over other performance testing tools is the advanced architecture with high performance and maintainability. Virtual users in Gatling are messages not threads. This gives Gatling a huge scaling advantage over thread-based tools such as JMeter and LoadRunner. The message-driven architecture allows you to run thousands of virtual users on a single machine and scale them up without facing any resource-related issues.
Among other benefits are:
great HTTP Protocol support
GUI recorder that converts captured traffic into Gatling scenarios that can be used to simplify script creation for a new application under test
test scenarios are easier to maintain as you can keep your code in the VCS (version control system) alongside the production code; this also enables you to run tests as part of CI (continuous integration)
The biggest downsides of Gatling compared to JMeter and LoadRunner are:
supports only a handful of protocols out of the box such as HTTP, WebSockets, Server-sent events, and JMS
the default metrics you get are quite limited; for more you need to use third-party plugins and extensions
Locust
Locust is an open-source distributed user load testing tool that focuses on measuring response times on websites and applications. It’s based on Python and features a simple UI which makes it very easy for you to check how many concurrent users your system can effectively handle. Locust creators have also moved away from the traditional thread-based approach and built their tool using an event-based architecture that uses two-three times less resources compared to JMeter and LoadRunner.
Some of the awesome things you can do with Locust are:
customize the behavior of each of your virtual users and scale them easily
monitor the load generation process in real time from a web UI
create your test scenarios using Python; maintain and configure performance tests for different environments under a version control system
Considering that the tool is rather new and the community is still growing, it’s biggest drawback is a very small library of plugins. Among other downsides are the lack of script recording functionality and ramp-up flexibility (the amount of time it takes a tool to add all test users to test execution).
k6
k6 is an open-source load testing tool with the main focus on back-end infrastructure. The tool itself is built in Go and scripts are written in JavaScript. The tool positions itself as developer-centric. What it means to say is that k6 prioritizes developer experience and code-based scripting and can be efficiently integrated into most development workflows and CI/CD pipelines. k6 offers both a free version you can use on your own infrastructure and a zero-maintenance SaaS version.
Other advantages of using k6 are:
ease of use due to its intuitive CLI (command-line interface) that shares a lot of UX aspects with popular DevOps tools
k6 scripts are based on JavaScript which makes them easier to write and run
test cases can be separated into different modules and the code reused among different tests
The shortcomings of using k6 are:
a tool with no GUI can’t be efficiently utilized by testers who are used to no-code UIs
supports only a handful of protocols out of the box such as web (HTTP/1.1, HTTP/2), WebSockets, gRPC, and SOAP/REST web services
Start performance testing your digital product in less than two weeks!
And finally, not exactly a performance testing tool in itself, SoapUI is a very flexible open-source solution for automated testing of SOAP and REST APIs. The tool enables you to quickly and easily create advanced load, stress, and endurance tests for your web services on the base of existing functional tests.
With SoapUI, you can:
include API performance tests early in the development process so that each build goes through at least some level of performance testing
reuse functional tests for different load/work scenarios to validate the performance of a particular web service
run several performance tests simultaneously to see how they affect each other before releasing to production environments
The biggest drawback of using SoapUI is that the free open-source version offers very limited functionality compared to ReadyAPI (formerly, SoapUI Pro) that’s locked behind a considerable price tag. The commercial version of the tool truly delivers on its purpose, but unless you intend to use it to its full potential, its performance testing features alone are not worth the buy.
Tips and Best Practices for Performance Testing
Now let’s talk about how to conduct performance testing effectively to get the most out of your efforts and ensure your software product delivers an optimal user performance. Obviously, some of the steps may be very specific for different companies depending on the nature of their business. Nevertheless, the general idea is pretty much the same across the board. Here are the key tips and best practices to keep in mind when planning and running your performance tests
Define clear goals
First and foremost, it’s important to establish what it is that you want to achieve. Are you trying to estimate the load capacity of your application? Or perhaps your goal is to improve the app’s response times? Whatever the case, defining clear goals from the get-go will help determine which tests to run and how to measure success.
Start testing early
One of the key testing principles and the cornerstone of DevOps agile approach, early testing is essential to deliver a high-quality app. When you start running performance tests early without waiting for the code to move into the integration stage, you minimize the chance of costly bugs and mistakes, which would take lots of time and money to fix later in development.
Keep user needs in mind
While you do testing to ensure the app’s seamless performance, you also do it to provide users with great experiences. Otherwise, there wouldn’t be much use from that app. Therefore, whatever you, make sure you do it with your end-users in mind. This will help you choose the right metrics to monitor and keep your product aligned with user expectations.
Be realistic
If your app is unlikely to be visited by ten thousands of users, there’s no point in testing scenarios that won’t happen. Instead, focus on simulating real-life situations that can help you assess how the app handles traffic coming from different devices, operating systems, and browsers and mitigate bottlenecks and performance issues.
Automate what’s possible
Performance testing can be quite time-taking, especially when dealing with large projects with frequent updates. To speed up testing, take advantage of automation tools. These tools can run tests more quickly and accurately, simulating thousands of various traffic scenarios without taking as much time as they would if done manually.
Monitor in production
While you should keep track of performance metrics in test environments, you should also test the app after deployment. This is an important part of testing that can help you spot issues, which you’d struggle to catch in test environments, and ensure lug-free performance.
Optimize performance
Don’t make changes to the test environment until you’ve analyzed the test results. Performance testing is a continuous process, requiring refining all the time. If you discover any issues with performance, implement solutions to resolve them and then run tests once again to confirm these issues are gone.
Test under different load levels
To ensure that your app runs smoothly in different real-world scenarios, run different performance tests. For example, breakpoint testing will help you find out at which point your application may fail, while endurance testing will allow you to evaluate for how long it’s able to maintain stable performance. Make use of a combined testing approach to better understand your app’s behavior under different conditions.
Final thoughts
Performance testing should never be left for last. It’s a crucial process that gives developers the diagnostic information they need to eliminate all the speed, stability, and scalability bottlenecks in your software solution. It also helps you prepare the capacity of your website or application for anticipated extreme conditions such as the holiday season for eCommerce platforms, fiscal year-end period for banking apps, or major sporting events for live-streaming services.
Unfortunately, many businesses still tend to ignore performance testing regardless of its obvious significance to the long-term success of their digital solutions. Instead of making it a part of the product development process on par with functional testing, many give performance testing a back seat, treating it as a last-minute task right before the deployment. This is fraught with significant technical debt as it may lead to numerous design flaws in your very system architecture (when left unattended) to be very difficult and costly to fix.
Words by
Maksym Khymii, Automation QA Team Lead at TestFort
“In the past, our clients used to underestimate the importance of performance testing and demanded that we start doing it a mere week before the release. We taught them that if we do find serious leaks or bottlenecks at a late stage, then it will be ten times more expensive and troublesome to fix them than if we noticed these problems in the early stages.”
Maksym continues:
“This is a particularly important question when it comes to issues found in software architecture after the public release. This means that you may well have to optimize application performance not at the code level, but by increasing hardware capacities, which will lead to constant and significantly higher maintenance costs. An extremely important criterion for the success of your software solution in the long term.”
Thus, it is always better to start performance testing during the system development life cycle to build performance standards into the implementation and make certain that the non-functional requirements for performance are met in full before the public release.
Share:
Jump to section
Hand over your project to the pros.
Let’s talk about how we can give your project the push it needs to succeed!
Andrew is an insatiably curious geek who loves writing about technological innovation, business development, and digital transformation in the globalized world. Throughout more than 5 years of experience as a writer for different media, startups, and tech companies, Andrew has meticulously studied every aspect of the tech industry and loves sharing his knowledge with the international community.